Advanced Release Charting Template – Part 2
In the first part of this blog series, we introduced the Advanced Release Chart Template and discussed how to communicate progress to customers and stakeholders using burnup and burndown charts. The second and final part of this blog series drills into the details of what’s being delivered in the release to help drive decisions and answer more specific questions about scope. Specifically, we’ll focus on prioritization and forecasting against the product backlog.

Prioritization (Working on the Right Things)
Forecasted burnup and burnup charts are usually the appropriate level of information to communicate progress to people interested in knowing if you’ll “hit the date” or “when the work will be completed”.
Those charts display how much work was completed and what effort is remaining, but it doesn’t communicate if you’re working on the right things. It treats the release backlog as one single unit and offers a binary response to the questions:
- how much will be delivered by x date?
- when will y scope be delivered?
If you are strictly focused on output, then answering these questions is sufficient. We offer a way to look inside the backlog to drive decisions about what’s really important.
Effort by Priority
Many times we try to discover what’s really important just to be told that “it all has to be done”. Rarely is this really the case. More often, it’s a matter of not having the information necessary to drive decisions or fear of damaging a new relationship with an important customer.
The product owner is responsible for driving prioritization with stakeholders and customers. We advise many of our customers to adopt a very simple prioritization approach called MoSCoW, which is comprised of 4 priorities:
- Must
- Should
- Could
- Won’t
It’s a simple and established mechanism and it gets people to start dividing the release scope into categories to help prioritize the work. The priority is applied each user story in the release backlog often requiring the addition of a custom field in your Agile Project Management software.
Let’s take a look at some examples.
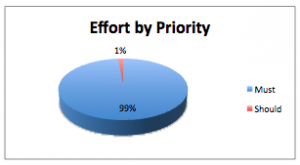
 This pie chart looks suspicious since almost all of the scope is categorized as “Must”. While it might be true, particularly in a fixed scope project, it’s more than likely wrong. Charts like these can help drive discussion and lead to decision making about what’s really important.
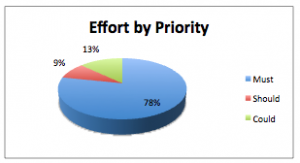
 Hopefully, those discussions will lead to a chart that looks more like this. At a glance, it appears to have a good mix of priorities reflecting the fact that people are making decisions about the scope. It also does not display any features that “Won’t” be built. “Won’t” is a useful priority, but you’ll rarely see those reflect in your chart since those are intended to be cut from the release scope.
Assigning priority is one way to define the importance of the release backlog items.
Effort by Feature, Epic or Initiative
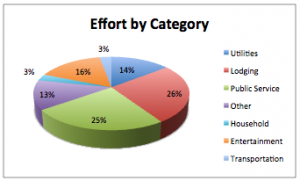
Another way to evaluate if the release is focused on the right outcome is to look at what you’re getting for your investment in a category. Category is being used to indicate any meaningful grouping of user stories that conveys values to your stakeholders or customers. Some other commonly used synonyms are: epic, feature, or initiative. Whatever terms you use the effect is the same which is to evaluate return on investment.
 The chart above is based on the categories identified for a Lego City backlog. In other words, when building a city using Legos where are we investing our time? The data shows a reasonable portfolio that shows a proportional investment needed to create a livable city. We might want more information about what value is being delivered in “Other” or wonder why “Transportation” is so much smaller than “Entertainment”. The point is to quickly identify if the effort or investment is proportional to the value. If it’s not, then drive discussion about how to correct the imbalance by adjusting the release backlog.
Backlog Item Forecasting (Low-Level)
Product owners and managers need a more detailed view of their backlog so they can add, change, delete, and reorder the backlog items. All Agile Project Management software offers this capability, but it may or may not provide the view you need to really understand it. To this end, we offer our ‘Product Backlog’ sheet as a place to export your backlog from your software so that you can understand it better.

The data provided at this levels allows for filtering, is needed to populate the charts described earlier, and provide confidence indications at a detailed level so you can answer the question “which features will make or not make the release”.
Drawing on the previous sections, we can see a full release backlog with the following characteristics:
- ordered by their confidence to make the release; the backlog items are ordered as follows
- completed work – anything finished will be in the release
- active work – anything in progress is expected to be completed and make the release
- new work – ordered by value and dependencies; may or may not make the release
- confidence lines drawn against the backlog, using cumulative effort, so you can provide your confidence that a feature will or won’t make the release
- green – 90% (new or active) or 100% (completed) confidence
- yellow – 50% confidence
- red – 10% confidence
- grey – 0% confidence; will not make the release
- order, priority and effort are visible for each backlog item
Using Our Template
All of the charts presented in this article are driven by the ‘Product Backlog’ worksheet which is a detailed view of the backlog populated from your Agile Project Management Software (e.g. TFS, Jira, Rally, VersionOne, etc.).
The backlog expects the following fields to be exported from your software:
- ID – some unique identifier for a product backlog item
- Priority – any set of values that distinguish importance of backlog items relative to each other (e.g. MoSCoW).
- Order – a value that indicates the order of a backlog item relative to another backlog item; retains the order found in your Agile Project Management tool
- Category – a grouping of backlog items such as an Epic; some tools do a better job than others allowing you to export this data
- Title – the name of the backlog item or user story; something descriptive so you understand what it is at a glance
- Story Points – an estimate of the effort required to complete the backlog item
- State – has the backlog item been completed, is it in progress, or has it not been started?
- Tags (optional) – not required but may provide another way to filter the backlog
The remaining fields in the ‘Product Backlog’ sheet are automatically calculated. Until the Agile Project Management software provides these capabilities we hope you will find our Advanced Release Charting Template useful.

Leave a Reply